1
2
3
4
5
6
7
8
9
10
11


Data visualisation/Illustration
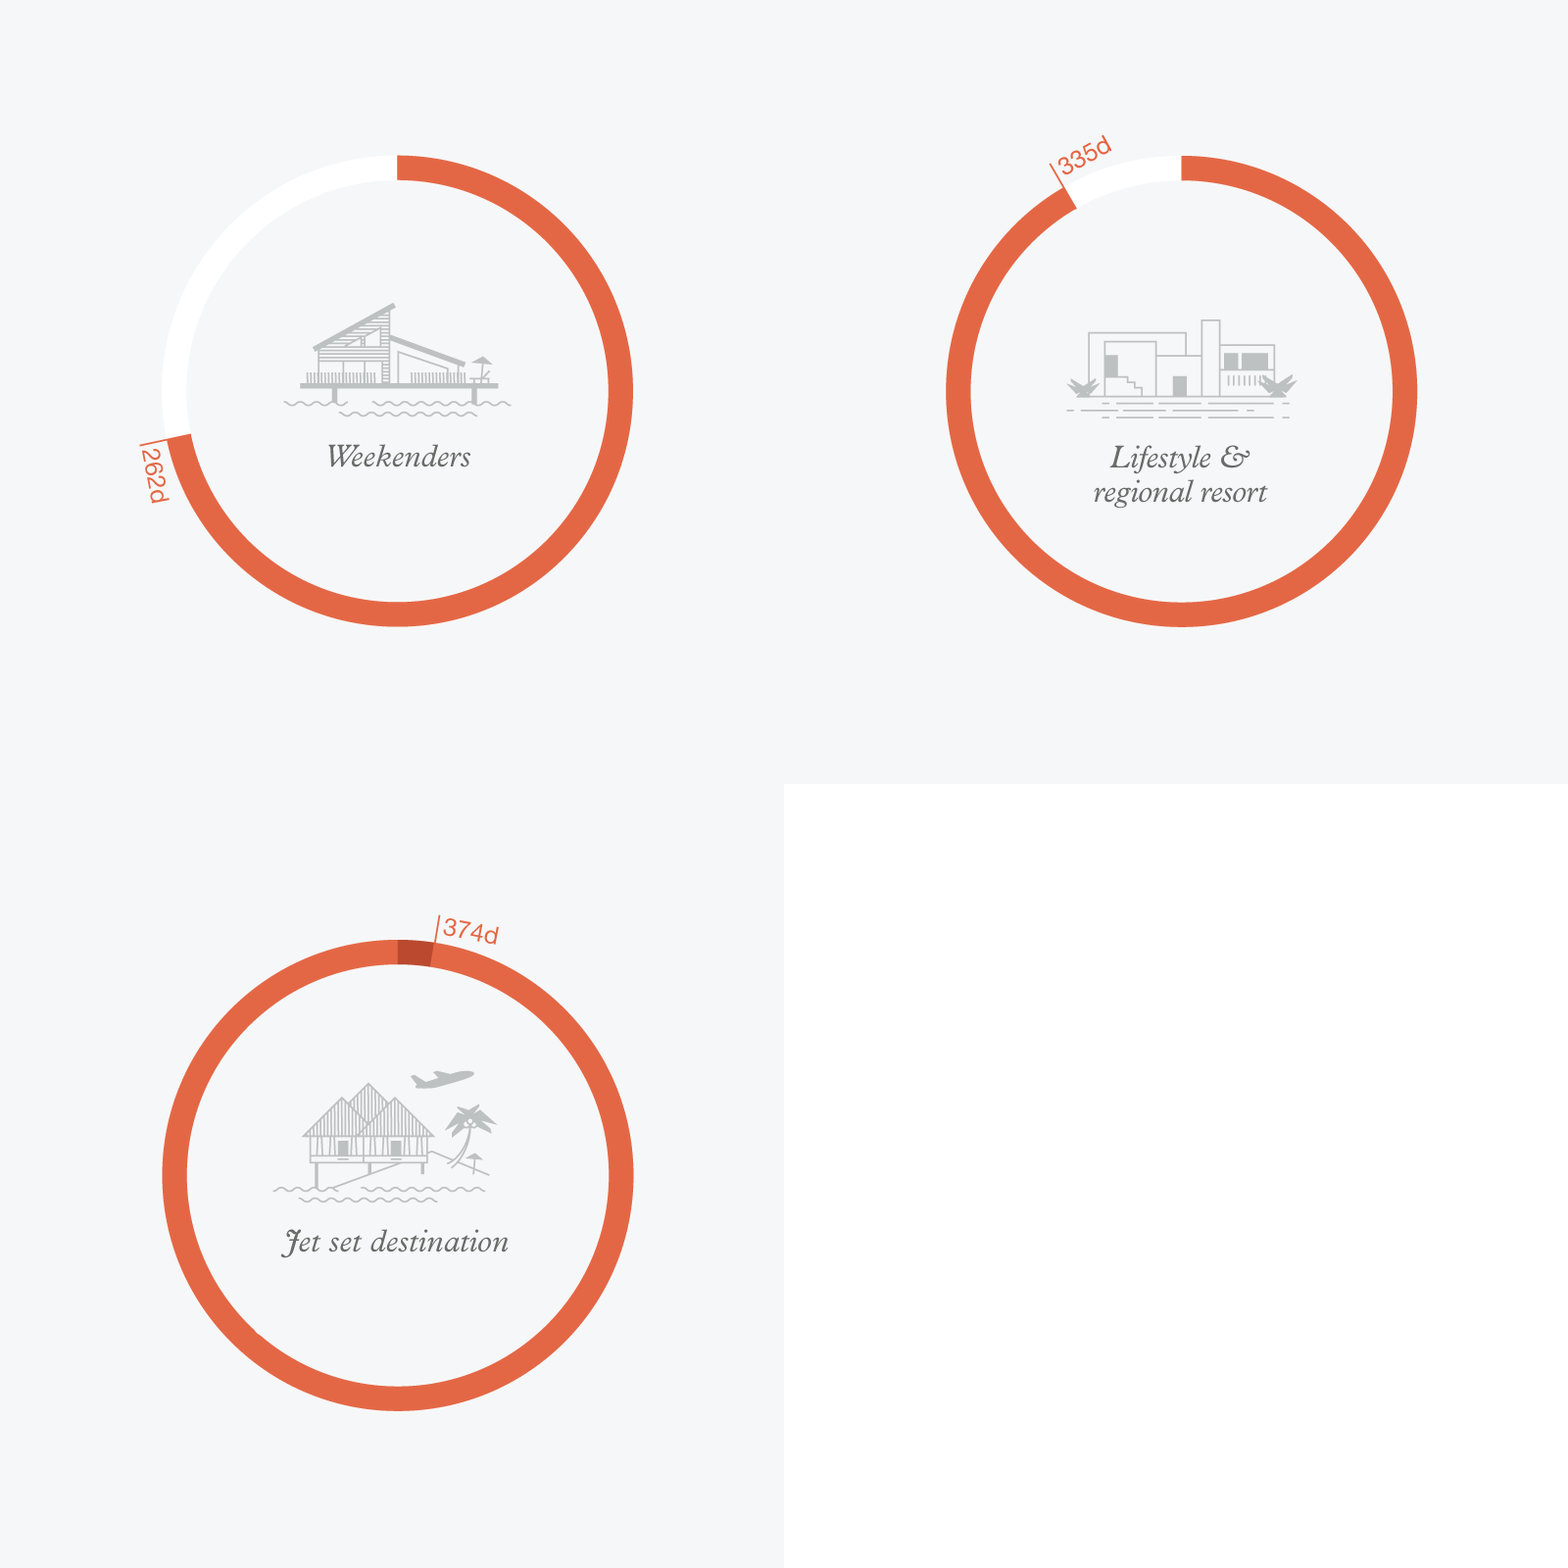
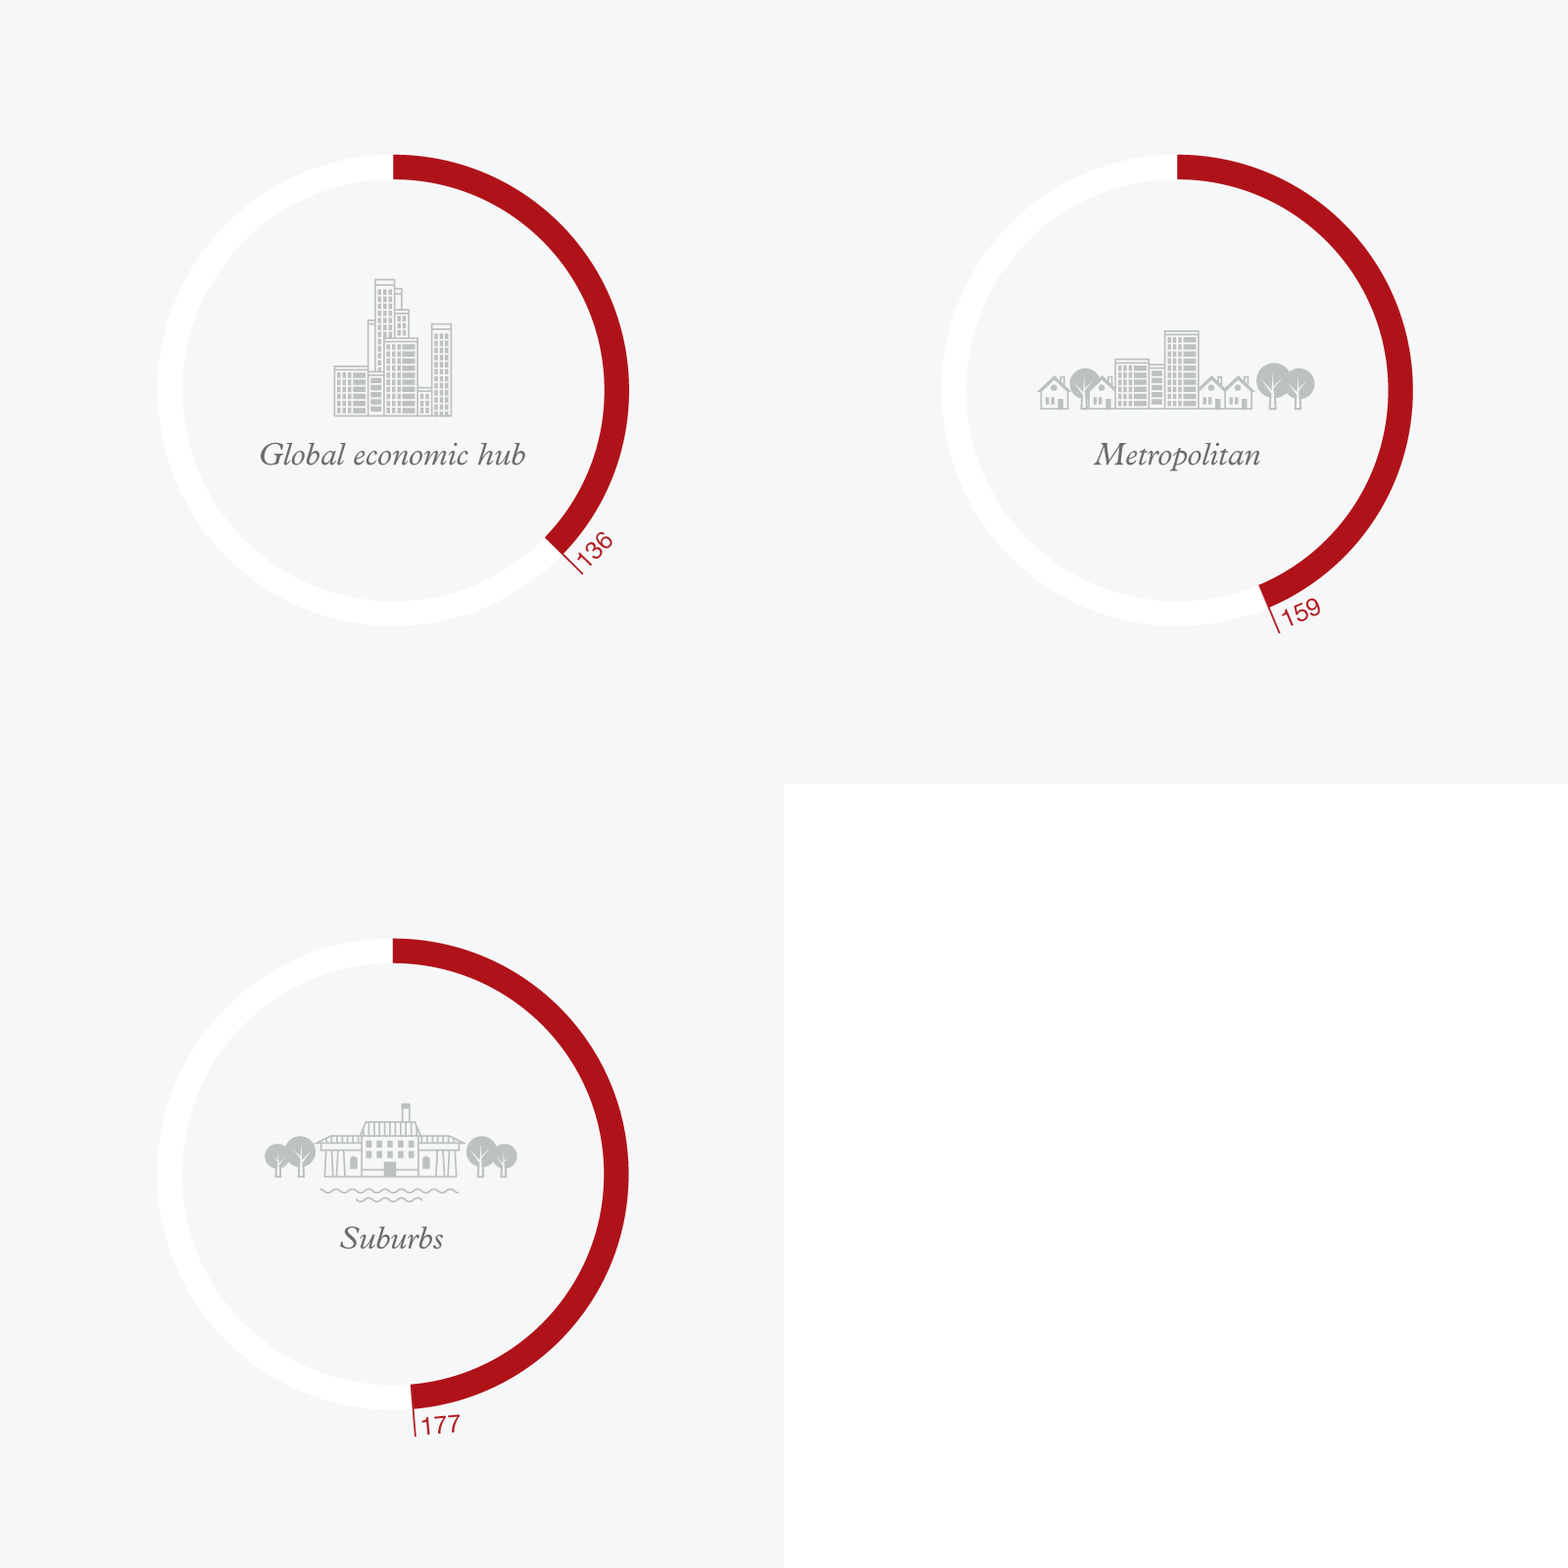
I worked with Christie’s to generate a series of data visualisations for their annual report. A key part of the job was to create a set of illustrations that encapsulated the six key markets and the luxury of the properties in each. I then needed to develop a style for the data visualisation that was in line with the exclusivity and prestige of the brand.
They were so pleased with the graphics that they asked me to convert them into shareable visualisations for the web.